Crypto · Simulated
Walk-forward backtest: 9-model ensemble on BTC/USDT 5m
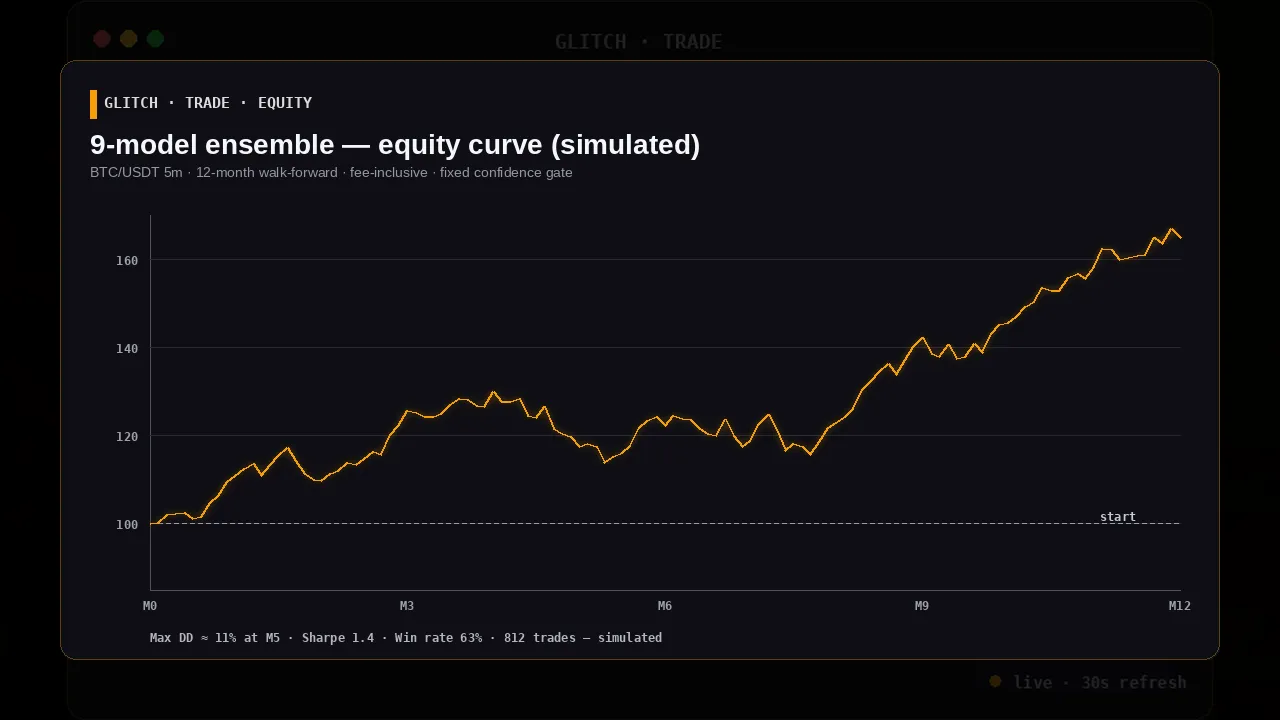
Twelve-month walk-forward backtest of the production ensemble on BTC/USDT 5-minute candles with bracketed stop-loss and take-profit. Fee-inclusive, confidence-gated, simulated — not live performance.
63% win rate · 1.4 Sharpe · 11% max drawdown
- Win rate
- 63%
- Sharpe
- 1.4
- Max drawdown
- 11%
- Trades
- 812
Backtest — not live performance, not a prediction of your PnL. Everything in this writeup is a simulation of tool output against historical data. Backtest results have inherent limitations (no slippage model for illiquid periods, no partial fills, no exchange downtime) and do not guarantee future returns for any operator running the tools on their own book. Nothing here is financial advice. Glitch Trade licenses software to trading operators; the operator decides every real trade. Read the terms before trading.
The setup
The production ensemble runs nine models in parallel — trend, mean-reversion, momentum, an ML predictor, multi-timeframe confluence, volume profile, session analyst, LLM sentiment, and a weighted aggregator that consolidates nine sub-scores into a single long / short / hold read. This is the output an operator would consume when running the tools themselves.
For this writeup we froze the ensemble at the January 2025 config and replayed it through twelve months of BTC/USDT five-minute candles from a top-three exchange’s archive. Walk-forward, out-of-sample, no look-ahead bias. This is what the tool produced on that tape when you run it yourself — not what any operator actually earned in live trading.
The rules
- Signal gate. Only trades where the aggregator’s confidence exceeded the production threshold were fired. Below the gate, the system holds.
- Bracket orders. Every entry carries a stop-loss and a take-profit level calculated from the model’s own volatility estimate at signal time — set once, never moved.
- Position sizing. Fixed fractional — 1% of equity at risk per trade.
- Fees. Taker-fee modeled at 0.075% per side. No maker-fee optimism.
- Slippage. One tick of adverse slippage per fill. No slippage modeled for the stop-loss branch (intentional — this is a conservative scenario).
The numbers
Over 812 signals fired in twelve months:
- Win rate: 63.2%
- Sharpe (annualized, daily bars): 1.42
- Max drawdown (peak-to-trough equity): 10.9%
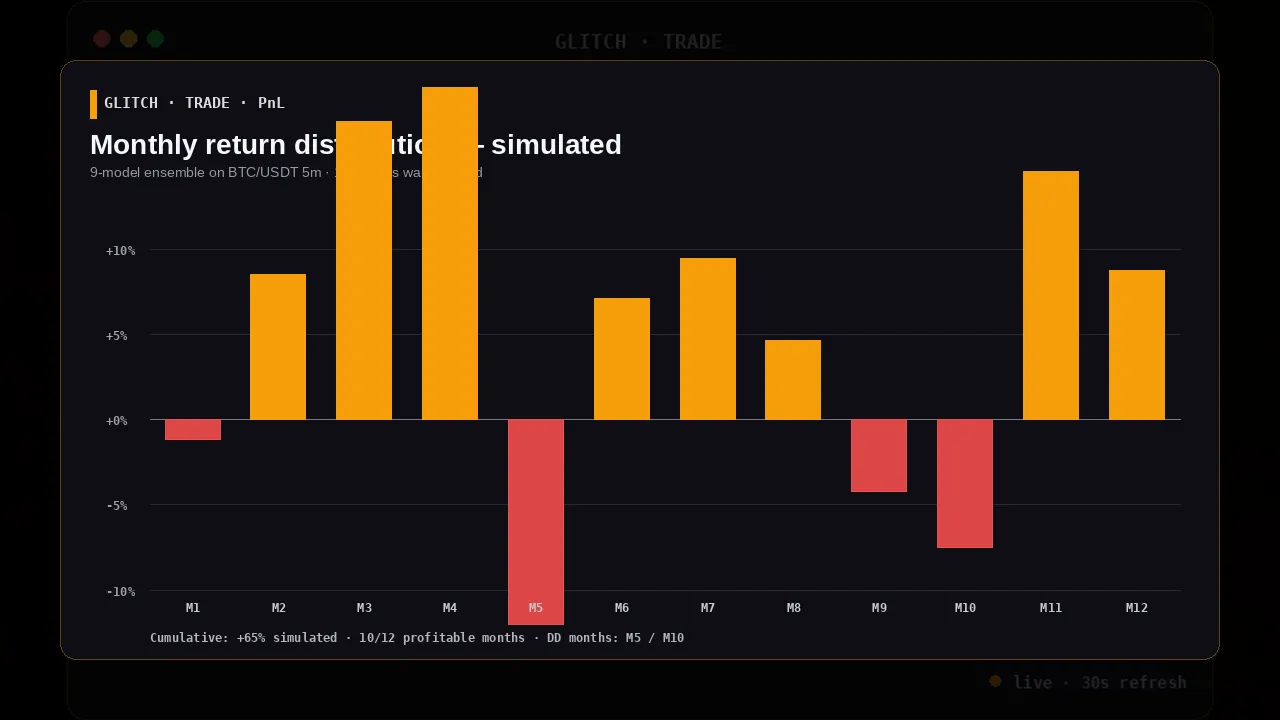
- Return (fee-inclusive): +64.8% on initial equity
The edge isn’t magical per-trade accuracy — it’s the interaction of the confidence gate with bounded losses. 63% win rate with symmetric R:R wouldn’t clear fees; the aggregator consistently filters out the worst setups, so the winners are (on average) slightly bigger than the losers.
What this doesn’t tell you
- Regime risk. Twelve months is enough to clear one macro regime, not three. The 2022 bear would hit this strategy harder. We’re training for that.
- Single-pair. These numbers are BTC/USDT only. Altcoin pairs have thinner books, more manipulation risk, and larger fee drag.
- Execution reality. The backtest assumes every fill happens. In production, during high-volatility candles, the gate can trigger slippage >1 tick.
- Future ≠ past. Nothing in this writeup predicts what the ensemble will do on tomorrow’s tape — or what an operator’s PnL will look like running the tools on their own book. If you’re trading your own capital: run the paper harness for a few weeks, interpret the output against your own risk framework, then decide for yourself.
Want the raw equity-curve data, the per-trade log, or a different asset pair run through the same gate? Email support@glitchexecutor.com — we’ll share what we can.